Have you ever wondered what the inside of a world-class observatory looks like?
On a run at the Magellan Baade 6.5-meter observatory in Chile last year, I took a full 4π steradian spherical panorama of the dome interior using Photosynth on my iPhone. The result is the interactive, scrollable panorama below:
Below the telescope you can see two of my colleagues coming down from one of the instrument platforms; they are both well over 6' tall and make good scale references. This is a huge machine.
I will post later about some of the data we collected on that run. Spoiler: Neptune has a new friend!
Alex H. Parker

Friday, February 22, 2013
Planetary Popularity
I have wanted to do something with the Google n-gram data for a while, and I've finally caved.
For those who haven't seen it yet, the Google n-gram browser allows you to see and compare the historic popularity of various phrases in books throughout history.
The default browser is fun and fast to play with, but I decided to take a crack at some of the raw data.
How about comparing the popularity of various planets (including the now-dwarf planet Pluto) in literature across the last few hundred years?
I give you "Planetary Popularity in Recent History:"
Details and a little interpretation below the fold.
For those who haven't seen it yet, the Google n-gram browser allows you to see and compare the historic popularity of various phrases in books throughout history.
The default browser is fun and fast to play with, but I decided to take a crack at some of the raw data.
How about comparing the popularity of various planets (including the now-dwarf planet Pluto) in literature across the last few hundred years?
I give you "Planetary Popularity in Recent History:"
 |
| Click to enlarge! |
Accidental Geoengineering
There are a lot of big numbers associated with climate change. The sheer scale of human activity is often lost in the numbers needed to describe it; millions, billions, and trillions.
Perhaps we need to contextualize our carbon dioxide production by comparing it to something else with similar bogglingly-big numbers: space.
To place human greenhouse-gase production into an astronomical context, I assembled a few choice comparisons into a convenient infographic. See it below the fold.
Punchline for the impatient: we produce a lot of CO2. One Halley's comet every decade, and one Martian atmosphere in 200-700 years (depending on assumptions about growth).
A Golden Age for Exoplanet Discoveries
After making a similar plot in my PhD thesis for the discoveries of minor planets throughout history, I thought it would be interesting to compare the rate of discovery of exoplanets to that of asteroids.

We are clearly in a golden age of exoplanet discoveries. In the past 23 years we have discovered over 800 confirmed planets in stellar systems outside out own; it took 114 years from the discovery of Ceres to find as many asteroids.
Alex H. Parker
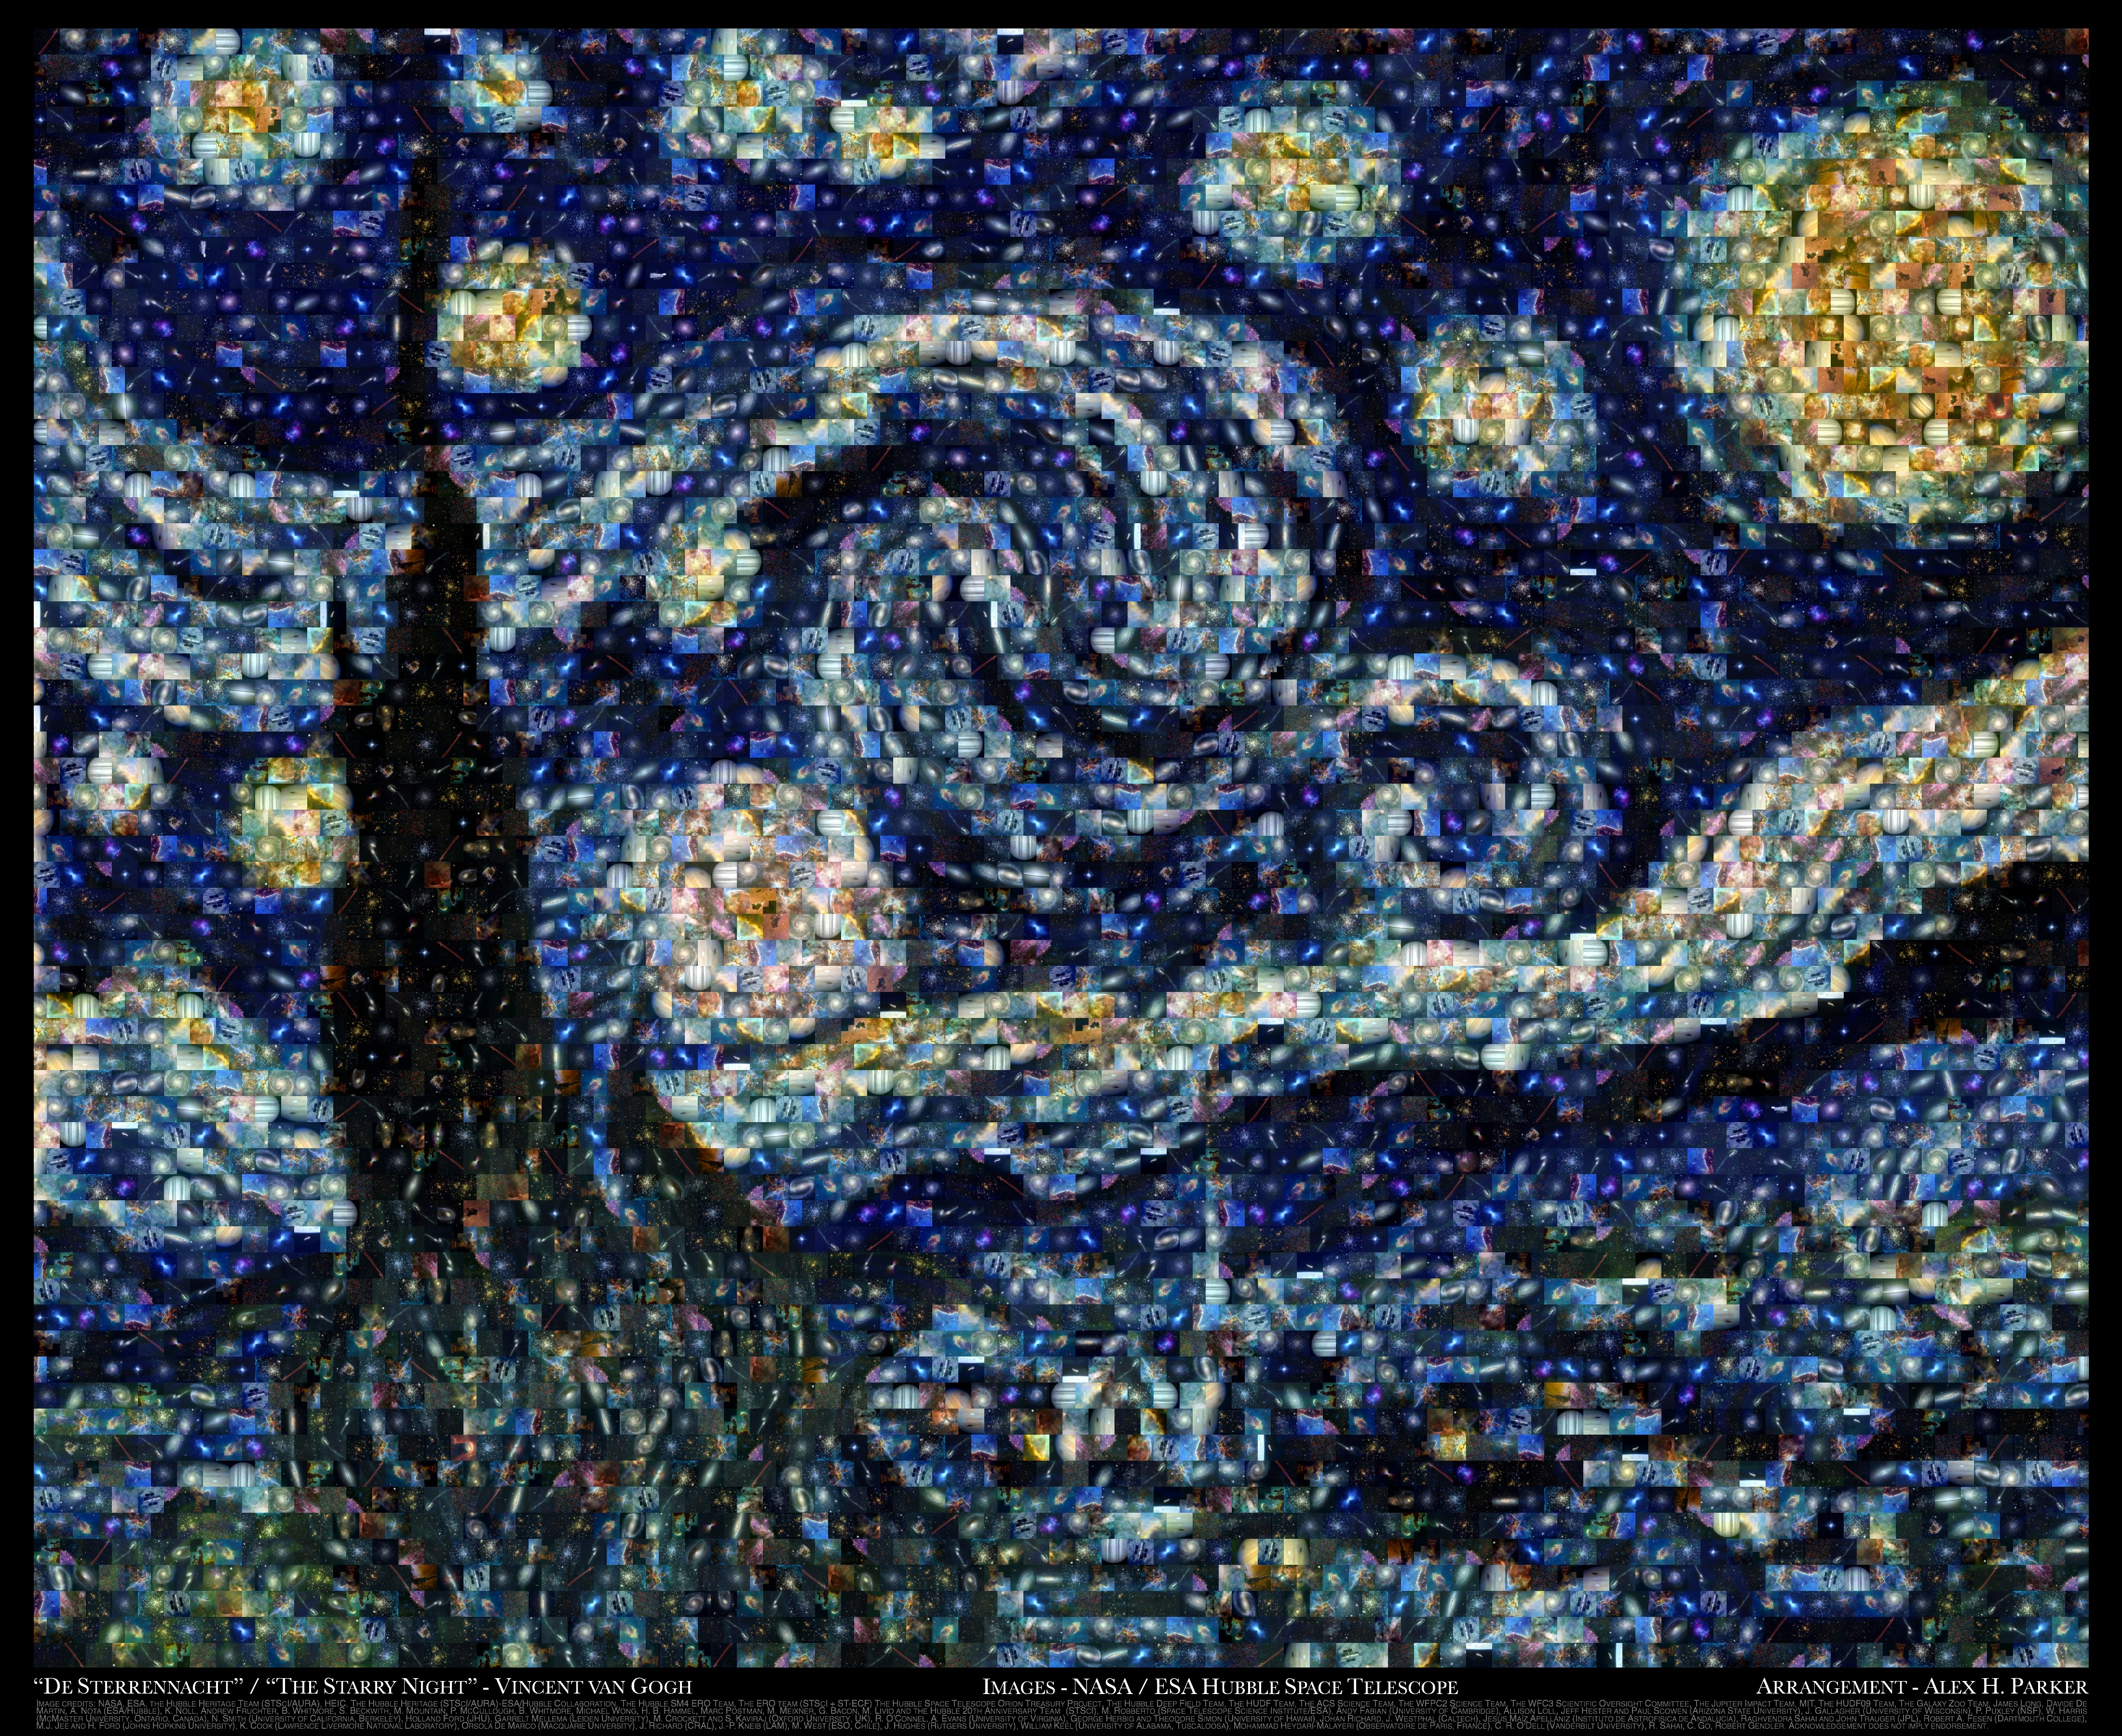
A Hubble Starry Night
Around the time of the Hubble Space Telescope's 22nd birthday, I created an homage to its legacy by assembling the Top 100 most popular Hubble images into a photomosaic of Van Gogh's famous "Starry Night" image.
Somewhat fittingly, I made this while waiting for clouds to part and reveal the stars during a night of remote observing.
I got a lot of requests to make the image available as a poster, so you can now order a print of it from Zazzle.
Alex H. Parker
 |
| Hubble Starry Night mosaic. Click to enlarge, or view a full-size 4400x3600 version. |
I got a lot of requests to make the image available as a poster, so you can now order a print of it from Zazzle.
Alex H. Parker
New Horizons Kuiper-Belt Fly Through
Fly with the New Horizons spacecraft as it cruises by dozens of newly-discovered Kuiper Belt Objects (KBOs) near its trajectory. These objects were found by our survey team (gray points) as well as by members of the public through Ice Hunters (purple points) during a search - still under way - to find a KBO for New Horizons to approach close enough to take detailed images and measurements of its surface. See below the break for details.
New Horizons Mission: Kuiper Belt Fly-Through from Alex Parker on Vimeo.
New Horizons Mission: Kuiper Belt Fly-Through from Alex Parker on Vimeo.
Worlds: The Kepler Planet Candidates
Worlds: The Kepler Planet Candidates from Alex Parker on Vimeo.
This animation shows the 2299 high-quality (multiple transits), non-circumbinary transiting planet candidates found by NASA's Kepler mission so far. These candidates were detected around 1770 unique stars, but are animated in orbit around a single star. They are drawn to scale with accurate radii (in r / r* ), orbital periods, and orbital distances (in d / r*). They range in size from 1/3 to 84 times the radius of Earth. Colors represent an estimate of equilibrium temperature, ranging from 4,586 C at the hottest to -110 C at the coldest - red indicates warmest, and blue / indigo indicates coldest candidates.
Watching in full screen + HD is recommended, so you can see even the smallest planets! Animation details below the break.
Kepler 11: A Six-Planet Sonata
Sonification of the transits of the remarkable Kepler 11 planetary system.
Located roughly 2000 light-years from Earth, the star Kepler 11 has a compact system of six planets, detected by the Kepler space observatory through their transits of their host star.
Kepler 11: A Six-Planet Sonata from Alex Parker on Vimeo.
Here, I've taken each transit seen by the observatory and assigned a pitch and volume to it. The pitch (note) is determined by the planet's distance from its star (closer=higher), and they are drawn from a minor 11 chord. The volume is determined by the size of the planet (larger=louder).
The near-4:5 mean-motion resonance of the innermost two planets is audible as the notes "beat" against each other.
A triple-transit (three planets crossing the face of the star at once) in August 2010 is also audible. This event is what is illustrated in the artist's impression of the system used in the cover photo.
Creative Commons license - 2012 - Alex Harrison Parker, Harvard-Smithsonian Center for Astrophysics.
[ Migrated from original post. ]
Wednesday, February 13, 2013
The Supernova Sonata
Supernova Sonata from Alex Parker on Vimeo.
From April, 2003 until August, 2006, the Canada-France-Hawaii Telescope watched four parts of the sky as often as possible. Armed with the largest digital camera in the known universe, CFHT monitored these four fields for a special type of supernova (called Type Ia supernovae) which are created by the thermonuclear detonation of one or more white-dwarf stars. These explosions are extremely energetic, and can be seen across vast distances in space.
These four fields covered roughly 16 times the area of the full Moon on the sky, or roughly 1/10,000 of the entire sky. Even though such a small fraction of the sky was monitored, 241 Type Ia supernovae were seen during the period of observation.
This video is a compilation of the 241 Type Ia supernovae seen in these fields during the CFHT Legacy Survey. The four Deep Fields are shown in color, and the positions of all the supernova are illustrated as time progresses. The animation is rendered at 15 frames per second, and each frame corresponds to just under a single day (one second in the animation corresponds to roughly two weeks of real time).
Each supernova is assigned a note to be played; details are below the break.
Subscribe to:
Posts (Atom)